Multiple Choice Quercus Quiz Analysis Reports
Quiz Analysis Reports
Although Quercus Quiz Statistics are often enough to help you understand the performance of your multiple choice questions, two detailed Quiz Analysis Reports are also available. These reports include:
- The Student Analysis Report, and
- The Item Analysis Report
Each report is produced as a comma separated values (CSV) file that can be downloaded and accessed with Microsoft Excel.
This guide is an overview of the two reports and how to interpret them
Student Analysis Report
The Student Analysis Report shows each individual student’s responses to the quiz questions. One row is assigned to each student in the course. The columns in the Student Analysis Report, from left to right include:
- name: Student name
- id: Quercus user ID
- sis_id: Student number
- section: Section name
- section_id: Quercus section ID
- section_sis_id: ROSI course code
- submitted: Date and time student submitted quiz
- attempt: Number of student quiz attempts
- *Question: Quiz question and student response
- *Points: Number of points possible and points earned
- n_correct: Number of correct questions
- n_incorrect: Number of incorrect questions
- score: Student overall quiz score
*Question and Points columns are repeated for each quiz question.
Item Analysis Report
The Item Analysis Report presents further statistical data related to quiz reliability, question difficulty, and discrimination. For more information about item analysis limitations and calculations, refer to the Canvas Item Analysis (PDF). One row is allocated for each question of the quiz. Columns in the report, from left to right include:
- Question ID: A unique number Quercus assigns to the question
- Question Title: The quiz question
- Answered Student Count: The total number of students that answered the question
- Top Student Count: The number of students who answered the question whose quiz scores were in the top 27%
- Middle Student Count: The number of students who answered the question whose quiz scores were the middle 46%
- Bottom Student Count: The number of students who answered the question whose quiz scores were in the bottom 27%
- Quiz Question Count: The total number of questions in the quiz. This number will be the same for each row
- Correct Student Count: The number of students who answered the question correctly
- Wrong Student Count: The number of students who answered the question incorrectly
- Correct Student Ratio: The proportion of students who answered the question correctly
- Wrong Student Ratio: The proportion of students who answered the question incorrectly
- Correct Top Student Count: The number of students whose quiz scores were in the top 27% who answered the question correctly
- Correct Middle Student Count: The number of students whose quiz scores were in the middle 46% who answered the question correctly
- Correct Bottom Student Count: The number of students whose quiz scores were in the bottom 27% who answered the question correctly
- Variance: Variance of scores for the question
- Standard Deviation: Standard deviation of scores for the question; the standard deviation is the square root of the variance
- Difficulty Index: The same number as the Correct Student Ratio for the question. This number lies between 0 and 1.0. Values below 0.3 indicate a very difficult question; values above 0.8 indicate a very easy question. Note: A higher difficulty index indicates an easier question.
- Alpha: The reliability of the quiz. This is a measure of internal consistency, and represents how well all the items measure the same information/skills/knowledge. This number lies between 0 and 1, and will be the same for each row.
- Point Biserial of Correct: This is also known as the Discrimination Index and appears on the Quiz Question Breakdown Statistics on Quercus. The Point Biserial of Correct is the association between performance on the question and the overall quiz. It ranges between –1.0 and +1.0. An ideal Point Biserial (+0.25 or greater) means students who scored higher on the quiz answered the question correctly and students who scored lower on the quiz answered the question incorrectly. Values of +0.24 or less indicate that the question does not effectively discriminate between high and low-scoring students. These questions should be revised.
- Point Biserial of Distractor: The Point Biserial of Distractor is the association between choosing a given distractor and performance on the overall quiz. It ranges between –1.0 and +1.0. This is the converse of the Point Biserial of Correct. Ideal values are between -0.25 and –1.0, meaning that selection of the distractor is associated with lower quiz performance. Similar values across distractors for a question is ideal, indicating that each distractor has a similar likelihood of being selected by students. Values close to 0 indicate that selection of that distractor is not associated with overall quiz performance.
Making Sense of the Point Biserial
Summary
The following can be used to guide the interpretation of point biserials of quiz questions:
Point Biserial of Correct
Optimal: +0.25 to +1.0
Sub-Optimal/Requires Revision: +0.24 or less
Point Biserial of Distrator
Optimal: -0.25 to -1.0
Sub-Optimal/Requires Revision: Close to 0 or positive
Questions with sub-optiomal point biserial values should be examined for test-item construction flaws. It is likely that the stem, correct answer, or one or more of the distractors requires revision.
Aligning Item Analysis Report Columns with Question Responses
It is important to be able to determine which point biserial column on the Item Analysis Report aligns with each alternative answer of your quiz question.
Here is a sample of the point biserial columns for two questions on an Item Analysis Report:
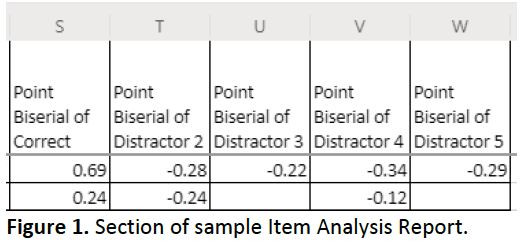
The first row of Figure 1 corresponds with the point biserials for the question:
Which of Freud’s defense mechanisms describes attributing one’s own inappropriate thoughts/feelings to someone else? *Correct Response.
a) Sublimation
b) *Projection
c) Regression
d) Displacement
e) Denial
The Point Biserial of Correct (0.69) corresponds with the correct response, b) Projection. The Point Biserial of Distractor 2 (-0.28) corresponds with the first distractor, a) Sublimation. Similarly, the Point Biserial of Distractor 3 (-0.22) corresponds with the second distractor, c) Regression; the Point Biserial of Distractor 4 (-0.34) corresponds with the third distractor, d) Displacement; and the Point Biserial of Distractor 5 (-0.29) corresponds with the final distractor, e) Denial.
Blank Point Biserial Cells
A blank point biserial cell on an Item Analysis Report reflects one of two cases, either:
- A distractor was not offered, or
- No students selected that distractor.
The second row of Figure 1 corresponds with point biserials for another quiz question. It has two blank cells: Point Biserial of Distractor 3 and Point Biserial of Distractor 5.
Given there is a value in Point Biserial of Distractor 4 cell, but the Point Biserial of Distractor 3 cell is blank, it is likely that no students selected distractor 3. In the case of the Point Biserial of Distractor 5, it may be that this question did not have a full set of distractors.